

Level Slider – Collapse Large Hierarchies
In large organisations the tree quickly grows so wide and deep that nothing of the overall picture is left: you scroll and zoom instead of seeing the structure. The level slider collapses the hierarchy in one step to as many levels as you want to see.
How to use it
Section titled “How to use it”The slider sits on the right of the filter row above the graphical view – on the same line as search and filter – marked by the layers icon. The number next to it shows the current setting – or “Alle” (all) when the entire hierarchy is visible.
- Drag it left to hide levels: at “1” you only see the top-most units, at “2” their direct children as well, and so on.
- All the way right shows every level again.
- The slider only goes as far as the hierarchy is deep. If there is nothing to collapse (a flat list without parent/child relations), it does not appear at all.
After each change the viewport adjusts automatically — but only as far as the boxes stay legible. A very wide tree cannot sensibly be squeezed into the window; the view then shows the upper area, says that not everything fits, and you move on by dragging and scrolling.
All levels of a large organisation at once – nothing here is readable any more:
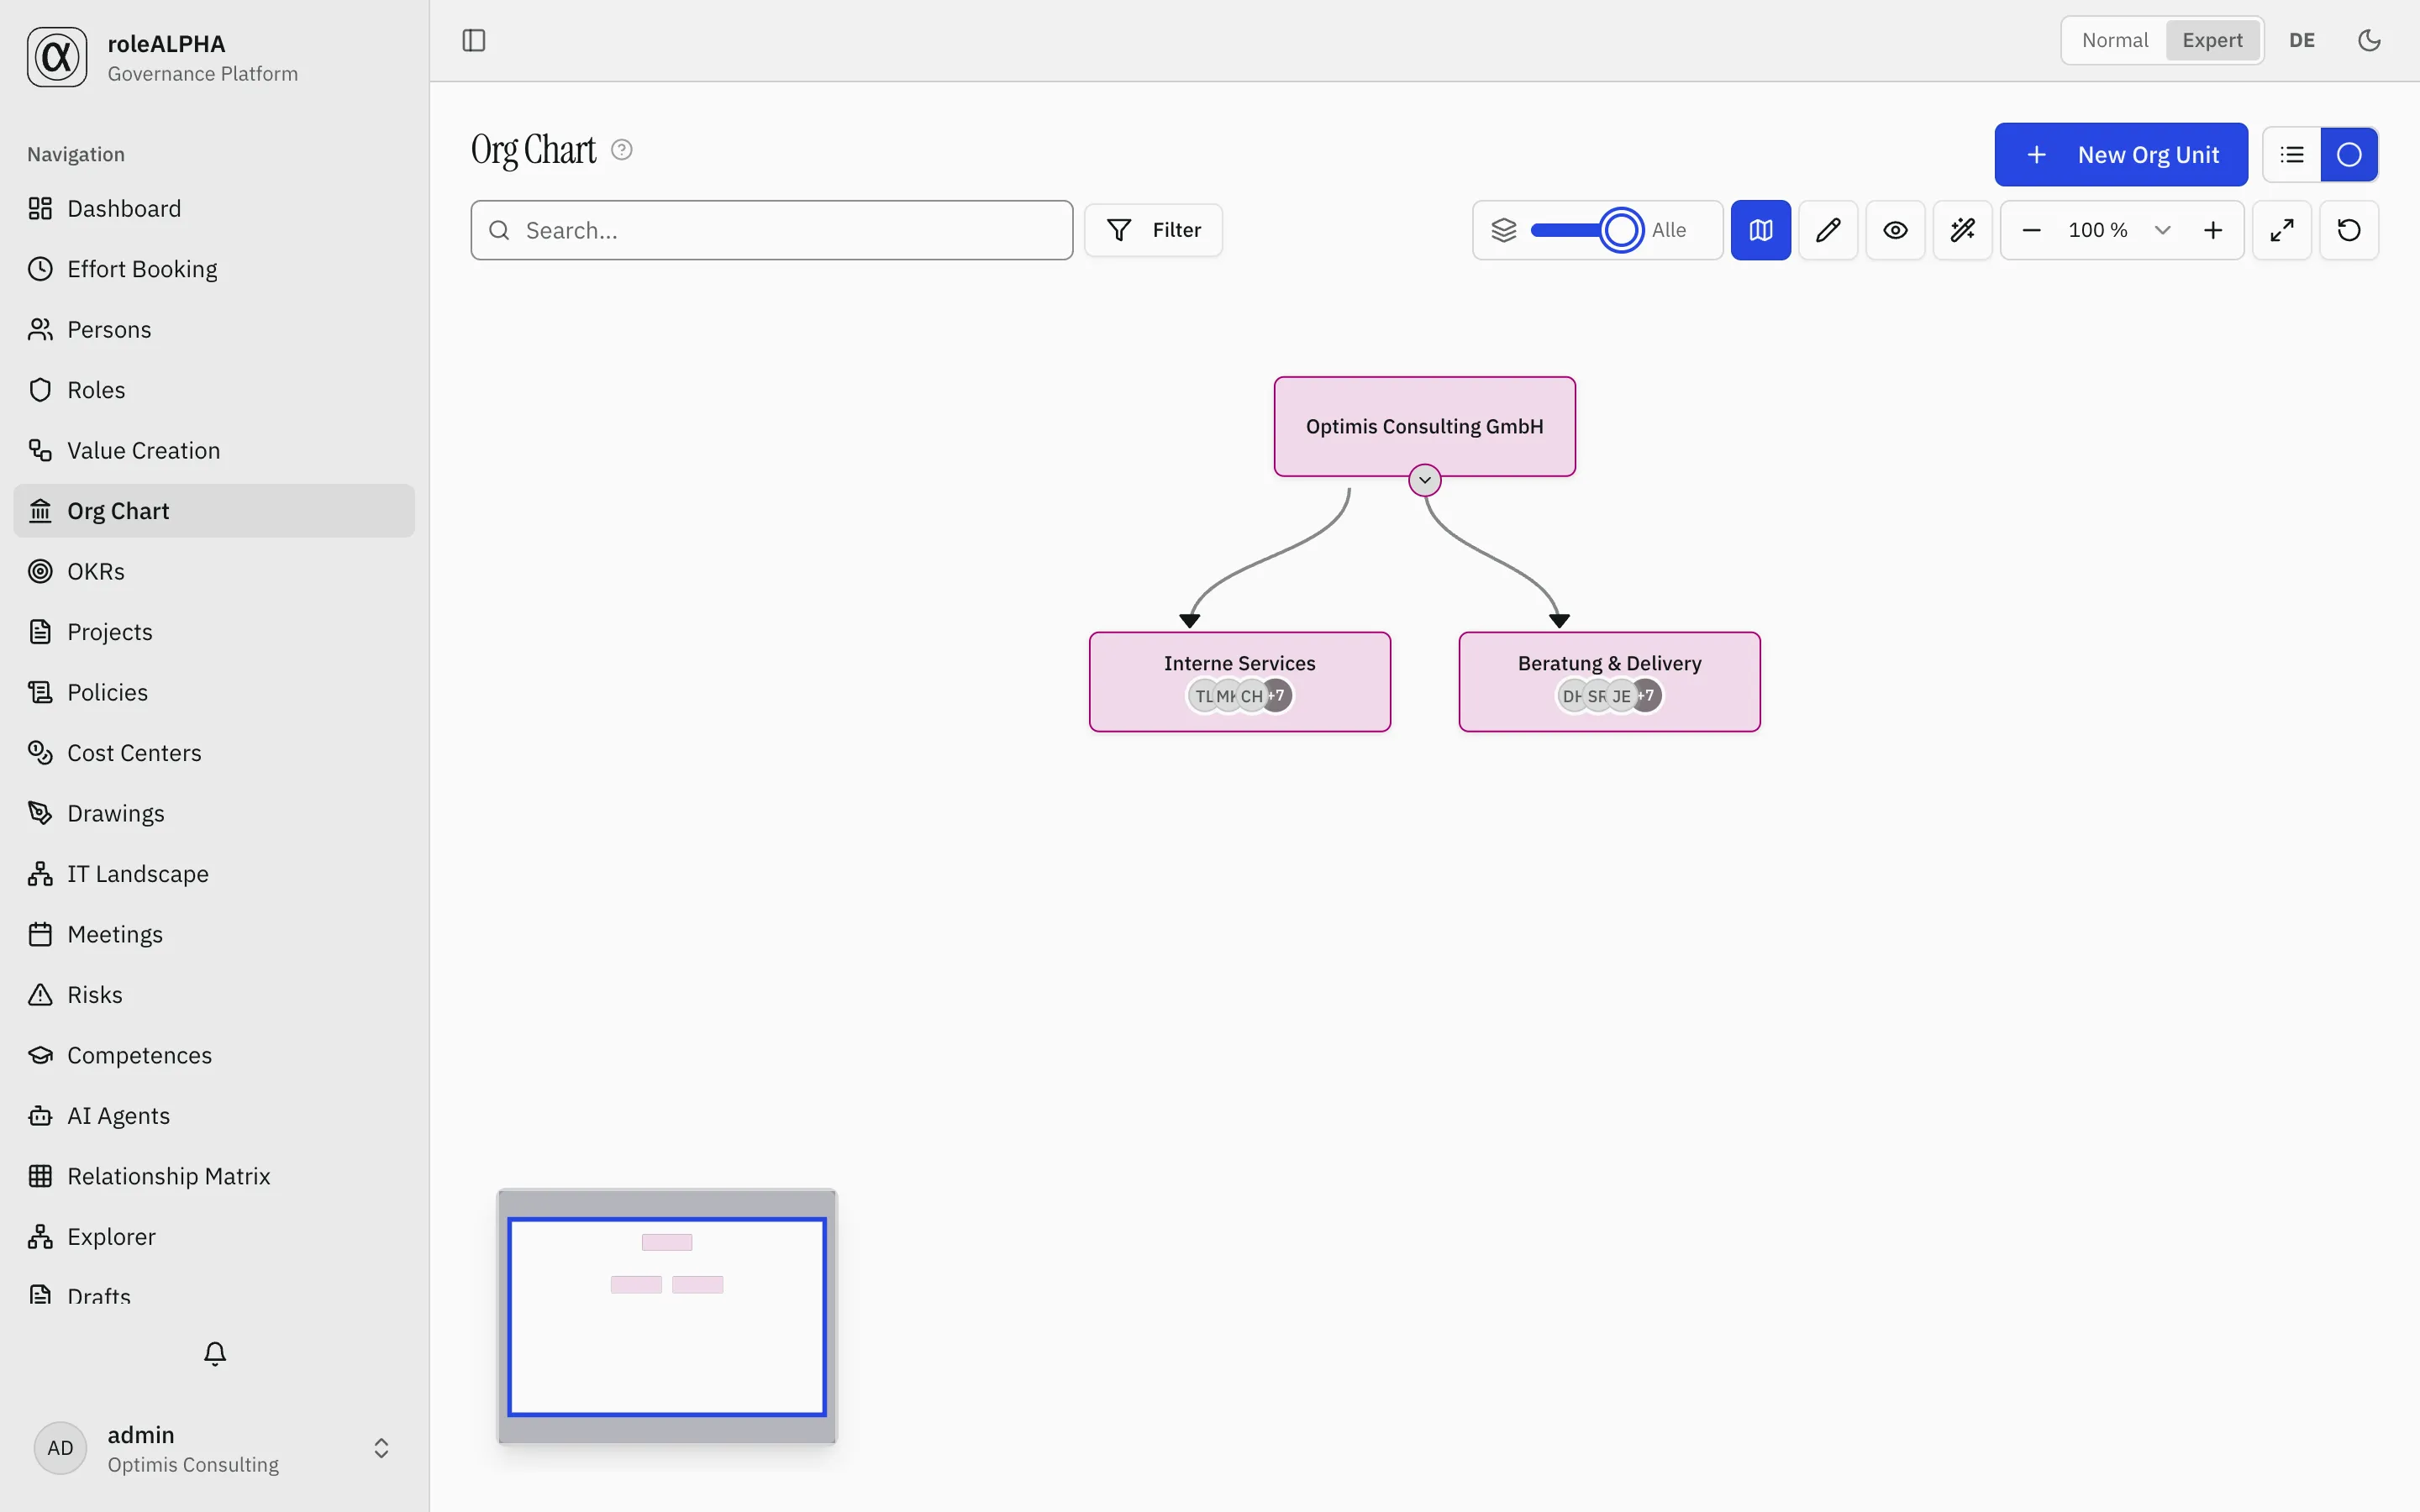
The same tree, limited to two levels. The number on a collapsed node tells you how many sub-units are hidden underneath:
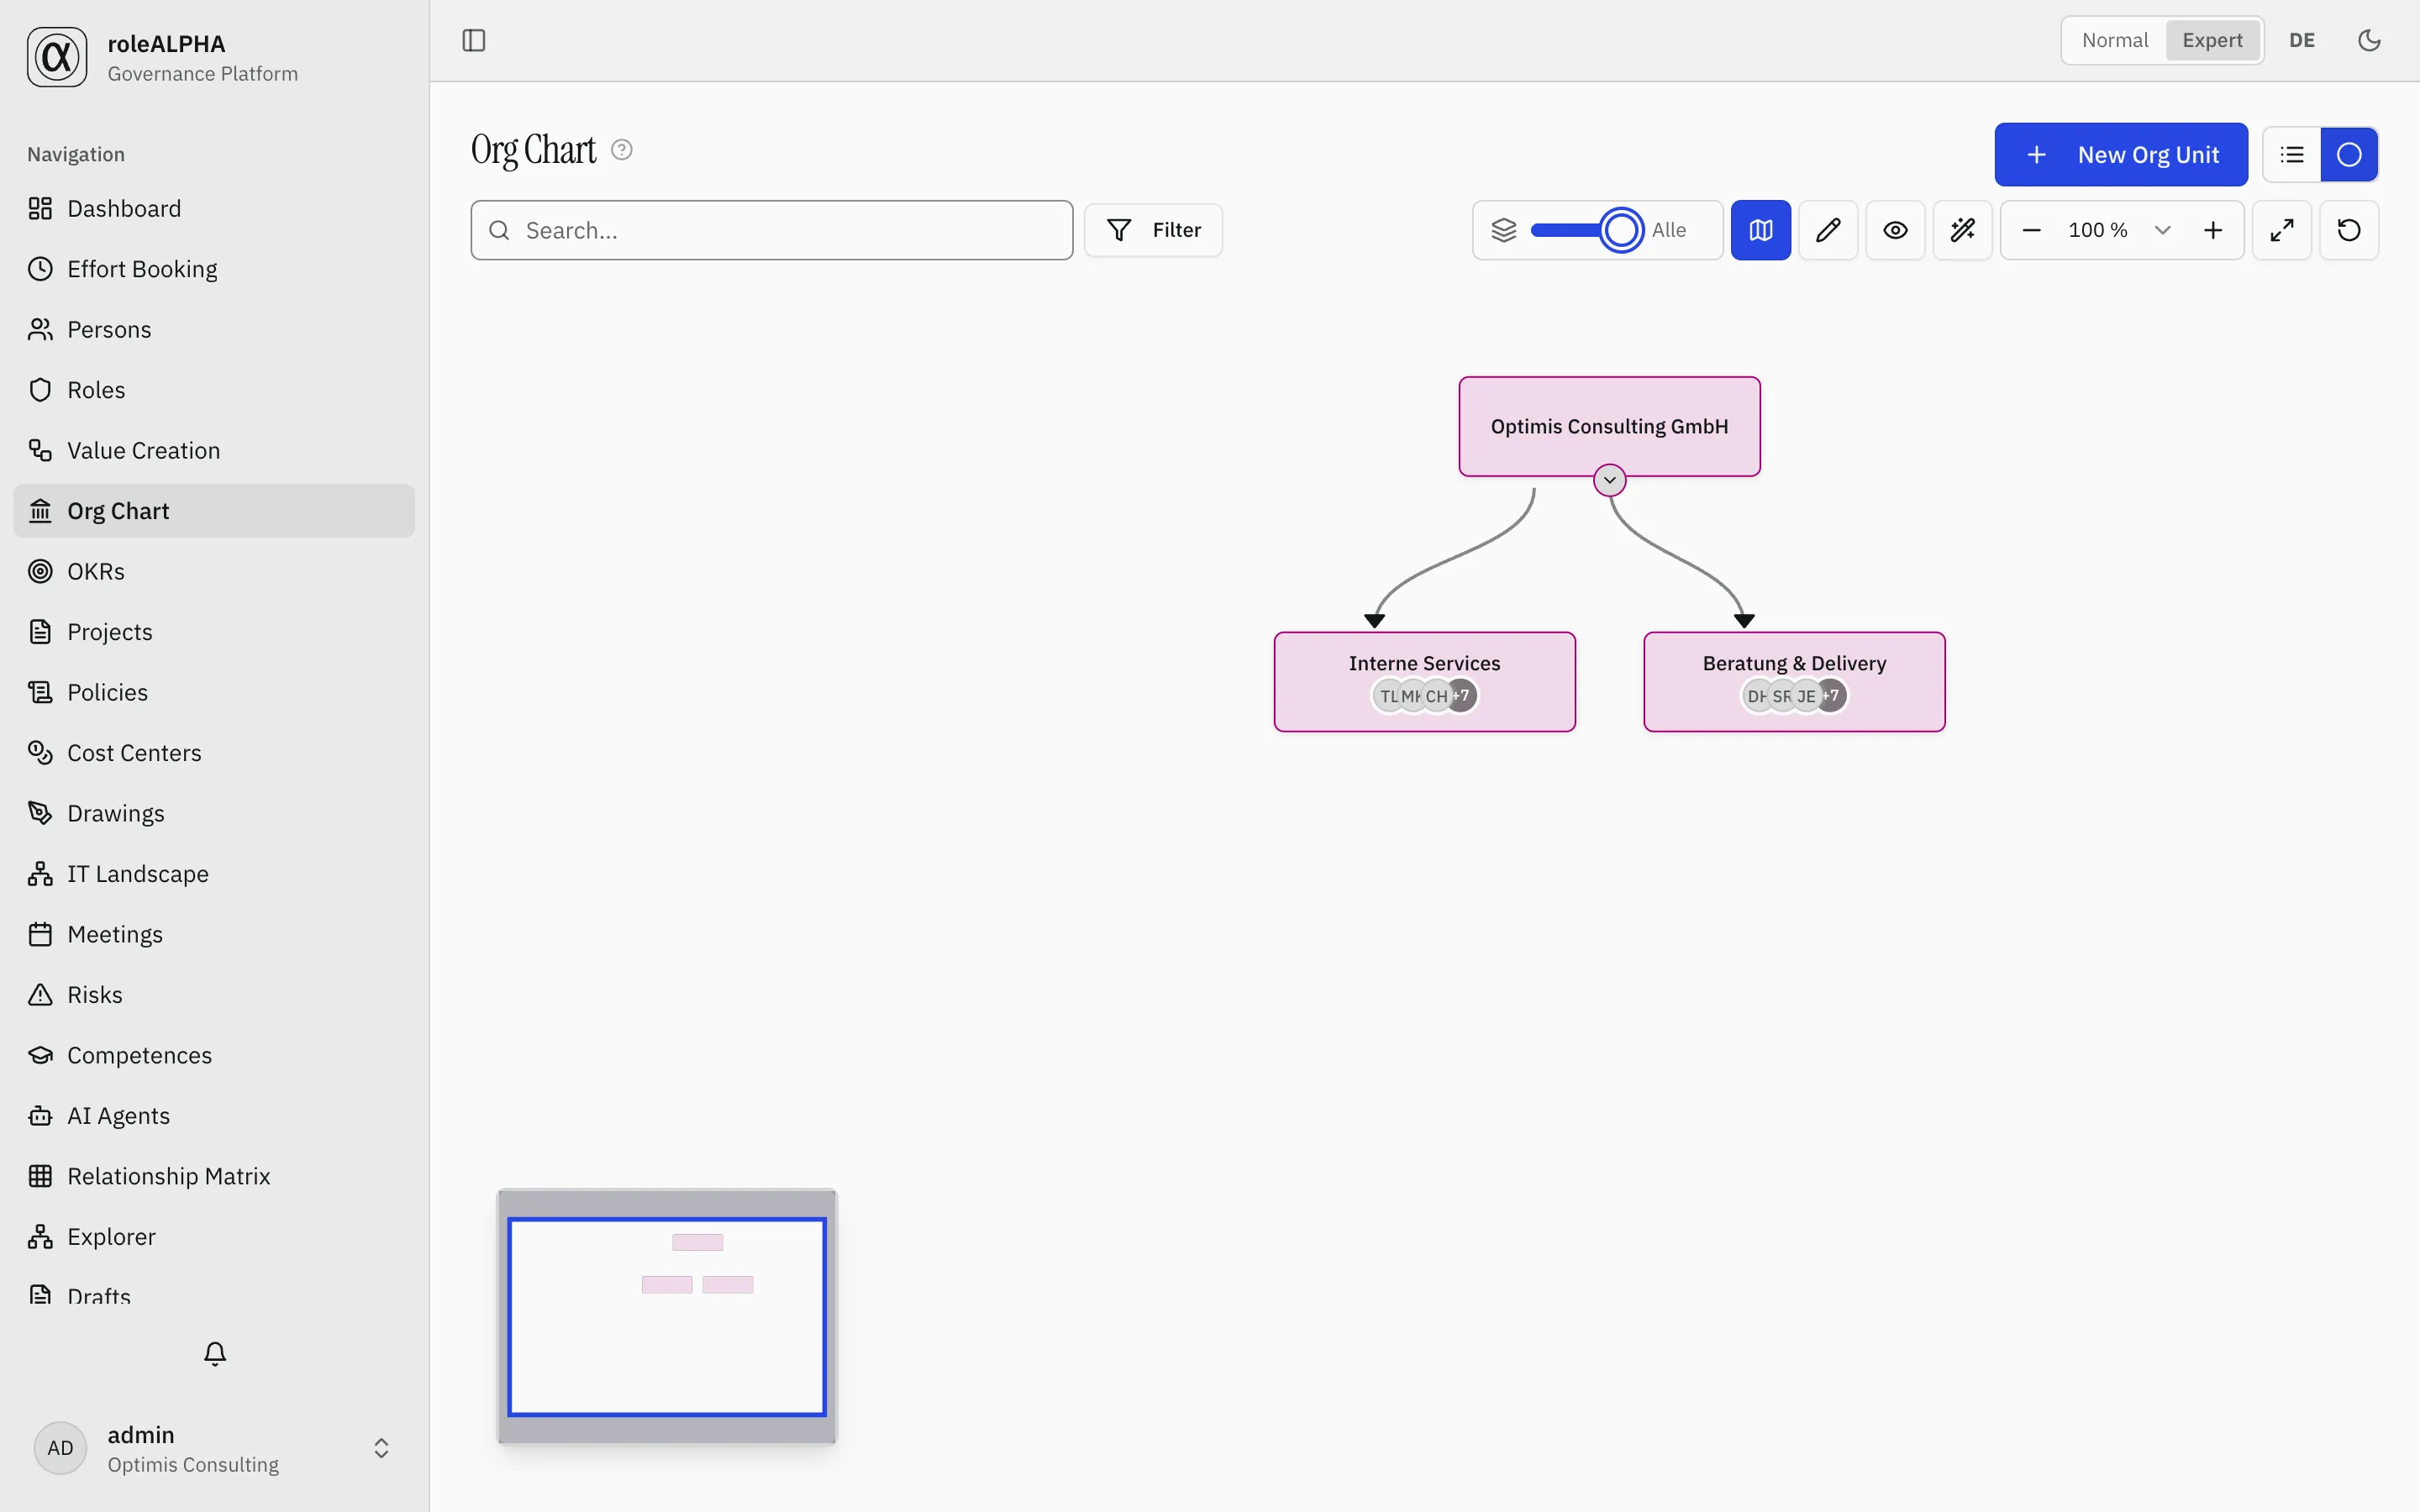
Expanding individual branches
Section titled “Expanding individual branches”The slider sets the starting point, it does not lock anything down. If you want to look into a specific area after collapsing, expand it as usual via the small arrow at the bottom of the card – everything else stays collapsed.
That is exactly the intended combination: coarse with the slider, fine with the arrows.
The slider deliberately does not follow those individual clicks – it stays at the level you last set. The reset button (circular arrow) in the same filter row expands everything again.
Where the slider is available
Section titled “Where the slider is available”- Explorer, whenever it shows a whole module — that is, on every module page. There it collapses the same hierarchy the page knows: parent and child units in the org chart, parent and subprojects, objectives with their sub-objectives, value streams with their sub-chains.
Two cases where it deliberately stays away rather than sitting there without effect:
- On the graph page the same slider means something else — the hops around the anchor, i.e. how far into the neighbourhood to load. Its label and maximum say which one applies; never both at once.
- When the picture is flat (nothing sits underneath anything else), there is nothing to collapse.
In a corporate group structure in the org chart (multiple company boxes, see Organigramm), the slider applies the same value independently to each company’s own internal org tree — the company boxes themselves always stay visible, only their contents collapse.
Large hierarchies open collapsed already
Section titled “Large hierarchies open collapsed already”For a large hierarchy the view does not wait for you to reach for the slider: it opens already collapsed and shows as many levels as can be taken in at a glance (roughly 40 boxes as a rule of thumb).
So this does not look like missing data, the view says so: above the picture it states how many of how many units are currently shown — for example “32 of 75 shown” — with an Expand all button right next to it. One click brings the whole tree back. The slider additionally sits on the chosen level instead of “All”.
Small hierarchies open fully expanded as before. As soon as you touch the slider or an expand arrow, the automatic behaviour stays out of your way.
Note: the chosen level only applies to the current session in that view. The next time you open it, it is determined again from the size of the hierarchy.
Searching inside a collapsed tree
Section titled “Searching inside a collapsed tree”A match that sits inside a collapsed branch is revealed by the search and brought into view; clearing the search returns the folding to its previous state. Details: Searching in graphical views.